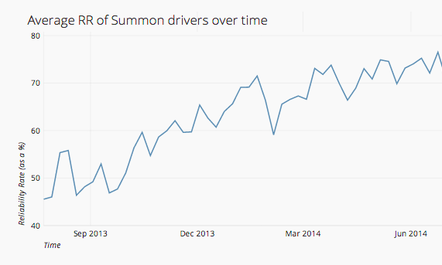
Average reliability rate of all active Summon drivers.
It was August 2013 and we had a problem. It had been nearly 6 months since we launched Summon. We had signed up hundreds of drivers in San Francisco. Our availability rivaled Uber and Lyft. Yet, we could not consistently get our riders a ride. The problem was that when riders made a request, we could not deterministically tell if the drivers closest to them would accept their request. This was because we could not get most drivers to accept a request with a high probability.
We tried to communicate regularly with our driver community to make sure they accepted most rides. However, doing things well manually is hard, especially when you are growing fast. Despite our efforts, most drivers didn’t grasp the effect their reliability had on the overall system. Riders would open their app to make a request, expecting to get matched to one of the several nearby drivers who appeared on the map. Often, the closest driver would reject the request, or worse, multiple nearby drivers would reject the request. This left the rider disappointed with a ride that was very far away or even more disappointed with no ride at all. Rider happiness and usage decreased. We realized we had to hold our drivers more accountable and do it in a more automated, scalable way.
Defining Reliability:
First, we had to define reliability in a way that can be measured by software. This was not hard. “Reliability rate (RR),” as we call it at Summon, is the number of rides that a driver accepts out of the total number of ride requests that the driver receives. At Summon, we measure reliability rate on a weekly (7 day) basis. For example, a driver who receives 100 ride requests in a week and accepts 80 of them has an 80 % RR.
Take 1: A plan for improving reliability:
Aristotle said: “We are what we repeatedly do. Excellence, then, is not an act, but a habit.” We had to figure out a way to get drivers to make reliability a habit. At a basic level, this meant they had to at least accept more rides than they rejected.
Simply stated, our system is reliable when a customer can get a ride whenever they make a request. Given the fact that we send each ride request to multiple drivers, we calculated that a driver must have at least an average RR of 50 % to set the probability of a rider getting a ride at an acceptable level.
Besides the pure math, we thought it was reasonable to expect a driver to pick up at least half of the requests sent to them.
The math was the easiest part, but the implementation the most difficult. We designed our system to automatically temporary block drivers if they had a RR under 50 % two weeks in a row. If this occurred a 2nd time, the driver would be permanently blocked by the system. We didn’t give drivers a third chance.
We also launched a massive campaign to educate drivers about why this change was being made: the fact that their maintaining a baseline RR would result in higher trust from riders and more riders for them.
A hitch in our plan:
Although rider usage initially saw an uptick because more reliable drivers were on our platform, driver usage went down.
To find out why, our operations team called hundreds of drivers each day. We learned that when a system is completely automatic, it can be difficult to understand how it works. Drivers mistrusted the RR number that they saw on their app because they didn’t understand how it was computed and how it changed between rides. We had missed out on a chance to clearly communicate to drivers how RR worked, even though they understood why it had been put in place. Drivers saw a number that changed, but did not quite understand how it changed. They thought our system was too strict and penalized them unfairly for things that were out of their control. For example, taxi drivers complained that they sometimes forgot to go offline. These were valid complaints, but as we dug deeper, we realized they were edge cases and that the bigger underlying problem was a perception of unfairness that stemmed from poor communication about how the system worked. The handful of drivers who did understand how RR worked did not complain about the edge cases as much. As drivers became disillusioned with the policy, we had fewer active drivers in the system and thus fewer ride requests. It was back to square one and time to act quickly.
Take 2: Better communication. Add some carrots. Aah, just right!
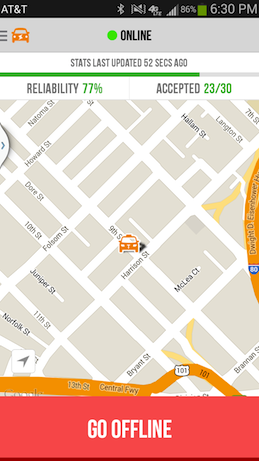
You can have the best set of rules for your marketplace, but if your sellers (and buyers) don’t understand them or trust them, they can actually be counterproductive. Good communication should be clear, and concise, and honest, and this is especially true of platforms like Summon that have a diverse array of users. To increase acceptance of our RR policy, we took away the perceived mystery around it. First, we put RR front and center in the app. Second, we made reliability rate a fundamental part of driver training. During training, we explained that riders were misled if drivers left their app to online but rejected rides. In the app, we showed the number of rides the driver had accepted out of the number of ride requests they had received over the last 1 week. As a driver accepted more rides, he or she could see their RR increasing in real time, which was very exciting and motivating for the driver.
This driver can see that they have a 76 % RR because they’ve accepted 22/29 rides in the last 1 week.

The driver sees their RR increase by a percentage point after accepting 1 more ride, increasing trust in the system.
In addition to better communication, we learned we also needed a “carrot,” not just a stick. We offered temporary monetary incentives for drivers with high RR along with the stick—blocking drivers from our system who consistently and frequently had a low RR under 50 %. We kept our basic policy that drivers should have an average of at least 50 % RR. However, we determined that we needed a bit of subjectivity even if it resulted in some manual work alongside the automated controls. We gave drivers additional chances if they had legitimate reasons that caused their RR to fall under 50 % (e.g. if a driver accidentally left the app set to online when she was unavailable, but she was generally a reliable driver who provided a safe and high quality rider experience).
As the graph above shows, Driver RR has shown a clear upward trajectory. Average RR was at the lowest point initially because of the difficulty of manually enforcing RR. Average RR rose when we implemented automated reliability tracking and enforcement, but the increase was limited because we didn’t communicate the concept well with drivers. We created a program that rewarded our top drivers – those doing a vast majority of our rides – in exchange for maintaining a minimum 70% reliability rate (soon to be 80%). Finally, RR reached a high point with “Take 2” and continues to rise (there are natural fluctuations over small time periods) as we’ve adopted more automated controls and better communication methods.
Driver complaints have reduced, and driver trust in the system has increased. We believe in constant improvement though. We’re currently adding external controls to simplify reliability even more for drivers with a feature that automatically turns a driver offline if they miss a certain number of requests inadvertently. This automated reliability safeguard helps good drivers remain within the Summon system and gives a realistic picture of driver supply to riders who open the app. It’s a work in progress, but we think we’ve achieved the simplicity and fairness that should characterize reliability in a good marketplace.
—–
This is the first in a series of posts about things that we have learned while building our marketplace. If you like this post, click here to sign up for an email when I publish my next post. You can also follow @summon on twitter. We try to keep our tweets sparse and relevant.

Leave a comment